.png)
2.2 Libraries and Clients
Mỗi chương trình nhỏ mà bạn đã viết đều nằm gọn trong một file .java. Với các chương trình lớn, không nên đặt toàn bộ code trong một file. Với Java, có thể gọi hàm từ trong các file khác. Điều này dẫn đến hai kết quả quan trọng đối với phong cách lập trình của ta:
- Nó cho phép ta mở rộng ngôn ngữ Java bằng cách phát triển các thư viện gồm các hàm static để dùng cho các chương trình khác, mỗi thư viện nằm trong một file riêng.
- Nó cho phép ta lập trình mô đun, ta chia chương trình thành các hàm, nhóm chúng lại theo ý nghĩa logic của chúng. Lập trình mô đun quan trọng ở chỗ nó cho phép ta độc lập phát triển, tìm lỗi, thậm chí biên dịch từng phần của một chương trình lớn. Mỗi phần được hoàn chỉnh trong file của riêng nó, và ta có thể sử dụng nó mà không bao giờ phải quan tâm đến chi tiết của nó một lần nữa.
Dùng các hàm static trong các chương trình khác.
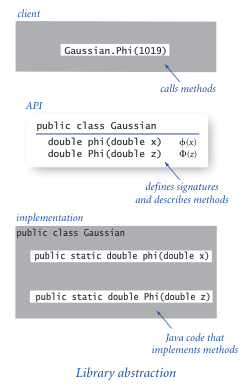
Để từ bên trong một class có thể gọi một hàm static được định nghĩa trong một class khác: Để cả hai class trong cùng một thư mục trong máy tính của bạn. Để gọi một hàm, viết tên class chứa hàm đó, dấu chấm, và cuối cùng là tên hàm. Ví dụ, SATmyYear.java gọi hàm Phi() của class Gaussian.java, hàm đó lại gọi hàm sqrt() trong Newton.java.Ta sẽ mô tả chi tiết về quá trình này.
- Từ khóa public. Từ khóa public quy định phương thức sau đó có thể được sử dụng bởi bất cứ chương trình nào truy nhập được tới class hiện hành. Bạn có thể dùng từ khóa private (và có một số loại khác nữa) nhưng tại thời điểm này việc đó chưa cần thiết.
- File .class . It is natural to use the term program to refer to all the code that we keep in a single file, and we use the term modular program to refer to a set of files that refer to methods in one another. Quy ước trong JavaL mỗi chương trình là một class (đặt trong một file .java trùng tên với tên class). Tạm thời, mỗi class chỉ là một tập các hàm static (một hàm trong số đó là main()). Khi bạn dịch chương trình (bằng cách gõ lệnh javac tiếp theo là tên file chứa class), trình biên dịch Java sẽ tạo một file với tên trùng tên class và phần mở rộng là .class, trong đó chứa mã nhị phân Java byte-code.
- Dịch khi cần. Khi bạn dịch một chương trình, trình biên dịch Java sẽ dịch tất cả những thứ cần thiết để chạy được chương trình đó. Nếu bạn dùng hàm Newton.sqrt() từ trong class Gaussian, khi bạn gõ javac Gaussian.java, Java cũng sẽ kiểm tra xem bạn có sửa Newton.java kể từ lần dịch gần nhất hay không (kiểm tra thời gian sửa đổi gần nhất giữa Newton.class và Newton.java ). Nếu có, nó cũng sẽ dịch cả Newton.
- Nhiều hàm main. SATmyYear, Newton, và Gaussian mỗi class đều có một hàm main(). Khi bạn gõ java tiếp theo là tên một class, Java sẽ chạy hàm main() static nằm trong class đó.
Libraries - Thư viện.
Ta gọi một class chứa các phương thức mà các chương trình khác sử dụng là một thư viện (library).- Client. Ta gọi client của một phương thức là chương trình sử dụng đến phương thức nào đó. Khi một class chứa một phương thức là client của một phương thức trong một class khác, ta nói rằng class thứ nhất là client của class thứ hai.
- API. API - giao diện lập trình ứng dụng - có thể được hiểu như là một hợp đồng giữa client và cài đặt thư viện, đó là một đặc tả tường minh về nhiệm vụ của phương thức.
- Implementations - Cài đặt. Ta gọi implementation là mã Java cài đặt các phương thức được quy định trong một API.
Cơ chế đó cũng áp dụng cho các thư viện người dùng tự xây dựng. API cho phép một client bất kì có thể sử dụng thư viện mà không phải quan tâm đến mã của cài đặt thư viện. Nguyên tắc của việc thiết kế API là cung cấp cho client các phương thức họ cần và không cung cấp phương thức nào khác. Ví dụ, Gaussian.java là một cài đặt của API sau:
Random numbers - Số ngẫu nhiên.
StdRandom.java là một thư viện sinh số ngẫu nhiên theo các phân bố khác nhau.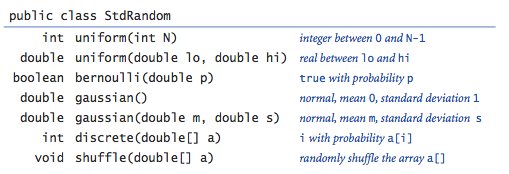
- API design. - thiết kế API Mỗi phương thức trong StdRandom sử dụng một số giả thuyết về các giá trị của tham số. Chẳng hạn, ta giả thiết rằng client sẽ gọi uniform(N) chỉ với N là số dương, và bernoulli(p) chỉ với p trong khoảng 0 đến 1. Tất cả các giả thuyết này là một phần của hợp đồng giữa client và cài đặt.
- Unit testing. Kiểm thử đơn vị
Tuy trong cài đặt StdRandom không nói đến một client cụ thể nào,
ta cần test các phương thức trong đó để đảm bảo chất lượng của chúng.
Cách đơn giản nhất là một hàm main() trong file đó. Hàm này
tuy không được dùng đến khi client sử dụng thư viện,
nhưng nó có ích trong việc tìm lỗi và test các hàm trong thư viện.
Mỗi khi bạn tạo một thư viện, bạn nên viết một hàm main() cho mục đích đó.
Việc test cẩn thận các hàm (unit testing) có thể là công việc khó khăn,
nhưng tối thiểu cũng phải làm được những việc sau
- chạy quan toàn bộ code
- đảm bảo ở mức độ nào đó rằng code chạy đúng
- lấy tham số từ dòng lệnh để test được nhiều trường hợp hơn, sau đó chỉnh sửa để test thư viện kĩ hơn.
- Stress testing. Một thư viện được sử dụng nhiều, chẳng hạn như thư viện này nên được thực hiện stress testing, ở hình thức này, ta đảm bảo rằng nó sẽ không crash khi chương trình client không làm đúng theo các giả thuyết trong hợp đồng hoặc dùng các giả thuyết mà thư viện không hỗ trợ. Chẳng hạn hàm discrete() nên làm gì nếu các phần tử mảng không có tổng đúng bằng 1?
Input and output for arrays. Nhập xuất mảng
Một thư viện rất hữu ích là thư viện gồm các hàm static hỗ trợ việc đọc các mảng kiểu cơ bản từ input chuẩn và in chúng ra output chuẩn, như định nghĩa tại API sau: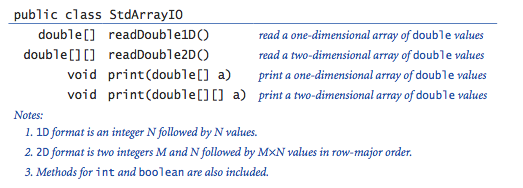
Iterated function systems. Các hệ thống hàm lặp
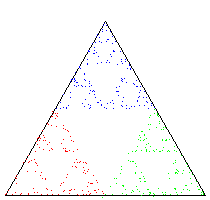
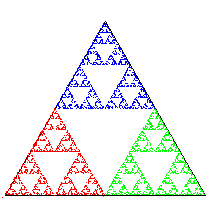
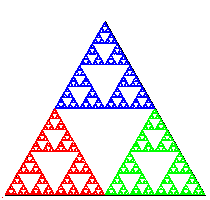
Một hệ thống IFS - Iterated function system là một cách tổng quát để tạo ra các hình fractal chẳng hạn như tam giác Sierpinski và hình lá dương xỉ Barnsley. Ví dụ thứ nhất, xét quy trình đơn giản sau: Cho một tam giác đều. Đầu tiên, vẽ một điểm tại một đỉnh của tam giác. Sau đó chọn ngẫu nhiên một trong ba đỉnh tam giác và vẽ một điểm mới nằm tại trung điểm đoạn nối giữa điểm vừa vẽ và đỉnh vừa chọn. Lại chọn ngẫu nhiên một trong ba đỉnh tam giác và vẽ một điểm mới nằm tại trung điểm đoạn nối giữa điểm vừa vẽ và đỉnh vừa chọn. Cứ như vậy.Sierpinski.java giả lập quá trình đó. Dưới đây là kết quả sau 1000, 10.000, và 100.000 bước. Bạn có thể nhận ra đó là tam giác Sierpinski .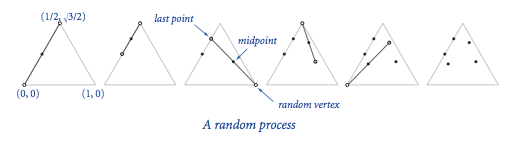
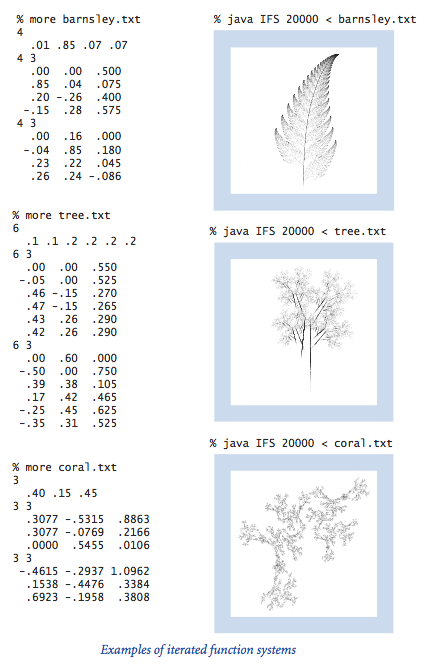
IFS.java là một chương trình giả lập quy trình tổng quát của quy trình trên, theo dữ liệu vào. Xem chi tiết tại sách.
Bạn có thể chạy nó với dữ liệu sierpinski.txt hoặc fern.txt hoặc tree.txt.
Standard statistics. Thống kê
StdStats.java là một thư viện dành cho các tính toán thống kê và vẽ biểu đồ đơn giản, nó theo API dưới đây. Xem chi tiết trong sách.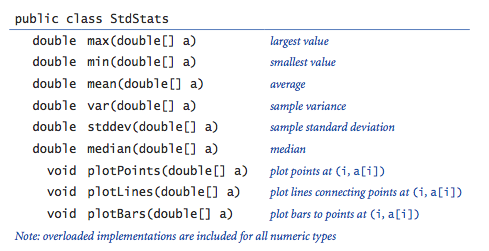
Bernoulli trials. Phép thử Bernoulli
Chương trình Bernoulli.java đếm số lần ngửa khi tung một đồng xu cân bằng N lần và so sánh kết quả với dự đoán bởi hàm phân bố Gauss. Theo Định lí giới hạn trung tâm ( Central Limit Theorem), phân bố Gauss với giá trị kì vọng (mean) N/2 và phương sai (variance) N/4 tính xấp xỉ cực kì sát với kết quả đo thực tế. Dưới đây là các output mẫu với N = 16, 32, và 64.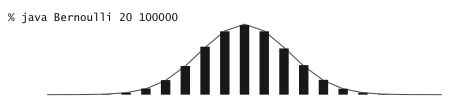
Modular programming. Lập trình mô-đun
Các cài đặt thư viện này minh họa một phong cách lập trình gọi là lập trình mô-đun - modular programming. Thay vì viết một chương trình mới chứa tất cả mọi thứ trong một file, ta chia nhỏ mỗi công việc thành các công việc nhỏ hơn, dễ quản lý hơn, sau đó cài đặt và rà lỗi độc lập cho từng công việc con. IFS.java và Bernoulli.java là ví dụ mẫu về lập trình mô-đun. Mỗi chương trình là các tính toán tương đối phức tạp được cài đặt trong vài mô-đun tương đối nhỏ.Chúng tôi nhấn mạnh phong cách lập trình mô-đun trong suốt cuốn sách này vì nó mang lại nhiều lợi ích quan trọng, trong đó có:
- Kích thước hợp lý của các chương trình. Không có bài toán lớn nào phức tạp đến mức không thể chia nó thành các bài toán nhỏ hơn.
- Rà lỗi - debug. Với lập trình mô-đun và nguyên tắc giữ phạm vi của các biến nhỏ hết mức có thể, ta hạn chế được rất nhiều trường hợp cần phải xem xét khi debug. Điểm quan trọng tương đương là khái niệm về hợp đồng giữa client và cài đặt. Một khi ta đã yên tâm rằng một cài đặt đã thỏa mãn các yêu cầu của hợp đồng đối với nó, ta có thể debug tất cả các chương trình client trên cơ sở giả thuyết rằng thư viện chạy đúng.
- Code reuse. Tái sử dụng mã chương trình Một khi ta đã hoàn thành các thư viện như StdStats và StdRandom, ta không phải quan tâm đến việc viết code để tính các giá trị trung bình hay độ lệch chuẩn, hay sinh số ngẫu nhiên nữa, ta chỉ việc dùng lại code đã viết.
- Maintenance. Bảo trì Cũng như một đoạn văn hay, một chương trình tốt luôn luôn có thể được cải tiến. Giả sử trong khi phát triển một chương trình client mới, bạn tìm thấy lỗi ở một mô-đun nào đó. Với lập trình mô-đun, việc sửa lỗi đó có hiệu quả bằng sửa lỗi tại tất cả các chương trình client của mô-đun đó.
Q + A
Q. Tôi đã thử dùng StdRandom, nhưng gặp thông báo lỗi sau. Vì sao?
A. Bạn cần download StdRandom.java vào thư mục chứa chương trình client của bạn, hoặc dùng cơ chế classpath của hệ điều hành máy tính bạn đang dùng.
Q. Có từ khóa nào quy định một class là một thư viện không?
A. Không một tập hàm public bất kì đều tạo thành một thư viện. Có một bước nhảy về khái niệm trong cách nhìn này, vì ngồi viết một file .java mà bạn sẽ dịch và chạy (có thể vài lần với các bộ dữ liệu khác nhau) là một chuyện, tạo một file .java mà bạn sẽ yên tâm sử dụng trong tương lai là một chuyện khác, và tạo một file .java để người khác sử dụng sau này lại là một chuyện khác nữa. Bạn cần phát triển một vài thư viện cho chính mình trước khi tham gia hoạt động này, đó là lãnh địa của những lập trình viên hệ thống giàu kinh nghiệm.
Q. Làm cách nào để phát triển một phiên bản mới của một thư viện mà tôi đã dùng một thời gian?
A. Hãy cẩn trọng. Mọi thay đổi đối với API đều có thể phá hỏng client bất kì, do đó tốt nhất là làm việc trong một thư mục khác. Nhưng khi đó bạn đang làm việc với một bản sao của code. Nếu bạn sửa một thư viện có rất nhiều client, bạn sẽ có thể hình dung được những vấn đề mà các công ty gặp phải khi họ phát hành các phiên bản mới của sản phẩm phần mềm của họ. Nếu bạn chỉ muốn bổ sung vài phương thức cho một thư viện, hãy làm đi, việc đó thường không quá nguy hiểm.
Q. Làm sao để biết một cài đặt chạy đúng? Tại sao không tự động kiểm tra xem nó có thỏa mãn API không?
A. Chúng tôi dùng các đặc tả không chính thức vì viết một đặc tả chi tiết không khác với việc viết một chương trình là bao. Hơn nữa, một nguyên lý nền tảng của khoa học máy tính nói rằng việc đó thậm chí không giải quyết được vấn đề cơ bản vì không có cách nào tổng quát để kiểm tra xem hay chương trình khác nhau có thực hiện tính toán giống nhau hay không.
Bài tập
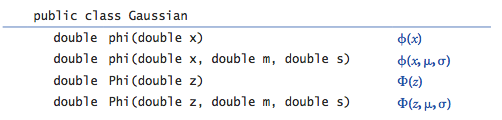
- Thêm vào Gaussian.java một hàm phi(x, mu, sigma) với nhiệm vụ tính phân bố Gauss với giá trị kì vọng (mean) μ và độ lệch chuẩn (standard deviation) σ, theo công thức φ(x, μ, σ) = φ((x - μ)/σ)/σ. Ngoài ra, viết thêm một hàm phân bố xác suất gắn với nó Phi(x, mu, sigma), theo công thức Φ(x, μ, σ) = Φ((x - μ)/σ).
- Viết các phương thức static trong Hyperbolic.java cài đặt các hàm lượng giác hyperbolic theo định nghĩa sinh(x) = (e^x - e^-x)/2 và cosh(x) = (e^x + e^-x)/2, các hàm tanh(x), coth(x), sech(x), csch(x) được định nghĩa tương tự với lượng giác chuẩn.
- viết chương trình client để test cả StdStats và StdRandom, kiểm tra xem tất cả các phương thức trong hai thư viện đó có chạy đúng hay không. Lấy một tham số dòng lệnh N, sinh N số ngẫu nhiên bằng các phương thức trong StdRandom, rồi in ra các thống kê. Mở rộng : Bảo vệ kết quả thử nghiệm bằng cách so sánh chúng với kết quả từ phân tích bằng toán học.
- Thêm vào StdRandom.java một phương thức shuffle() lấy một mảng các giá trị kiểu double làm phân số, xếp lại theo thứ tự ngẫu nhiên. Viết một chương trình client để test xem số lần xuất hiện của mỗi hoán vị có gần bằng nhau hay không.
- Viết một chương trình client thực hiện stress testing đối với StdRandom. Đặc biệt chú ý tới discrete(). Chẳng hạn các xác xuất cộng lại có bằng 1 hay không?
- Hoàn thiện StdArrayIO.java (cài đủ 12 phương thức như trong API).
- Viết một phương thức lấy các giá trị double ymin và ymax (với ymin nhỏ hơn ymax) và một mảng double a[] làm tham số và sử dụng thư viện StdStats để điều chỉnh các giá trị trong mảng a[] theo tỷ lệ tuyến tính sao cho chúng nằm trong khoảng từ ymin từ ymax.
- Viết một chương trình sử dụng Gaussian.java và StdStats.java tìm hiểu hiệu ứng của việc thay đổi các giá trị kì vọng (mean) và độ lệch chuẩn (standard deviation) đối với đồ thị phân bố Gauss. Vẽ các đồ thị với mean cố định và standard deviations thay đổi, và các đồ thị khác với standard deviation cố định và means thay đổi.
- Add to StdRandom.java a static method maxwellBoltzmann() that returns a random value drawn from a Maxwell-Boltzmann distribution with parameter σ. To produce such a value, return the square root of the sum of the squares of three Gaussian random variables with mean 0 and standard deviation σ. The speeds of molecules in an ideal gas have a Maxwell-Boltzmann distribution.
- Sửa chương trình Bernoulli.java để tạo hiệu ứng động cho đồ thị, sau mỗi thử nghiệm lại vẽ lại, để bạn có thể xem đồ thị hội tụ về phân bố chuẩn. Sau đó thêm một tham số dòng lệnh và một hàm binomial() cho phép quy định xác xuất p của việc đồng xu sẽ ngửa khi được tung, sau đó chạy thử nghiệm để quan sát về phân bố ứng với đồng xu không cân bằng. Hãy thử các giá trị khác nhau của p gần với 0 và gần với 1.
-
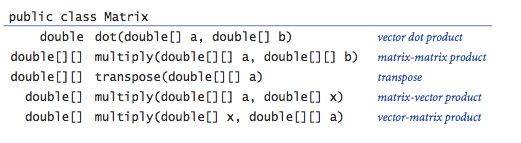
Viết thư viện Matrix.java cài đặt API sau.
- Write a Matrix.java client MarkovSquaring.java that implements the version of Markov.java described in Section 1.6 but is based on squaring the matrix, instead of iterating the vector-matrix multiplication.
- Viết lại RandomSurfer.java để dùng các thư viện StdArrayIO.java và StdRandom.java .
- Add a method exp() to StdRandom.java that takes an argument λ and returns a random number from the exponential distribution with rate λ. Hint: If x is a random number uniformly distributed between 0 and 1, then -ln x / λ is a random number from the exponential distribution with rate λ.
Creative Exercises
- Sicherman dice. Xúc xắc Sicherman
Giả sử bạn có hai con xúc xắc 6 mặt cân bằng. Một con có 6 mặt ghi các số 1, 3, 4, 5, 6, và 8.
Con kia là 1, 2, 2, 3, 3, và 4.
Hãy so sánh xác xuất xuất hiện của từng giá trị của tổng của hai con xúc xắc khi gieo cả đôi.
Sử dụng StdRandom và StdStats.
Đáp án: xúc xắc với các tính chất trên được gọi là Xúc xắc Sicherman: chúng tạo ra các tổng với cùng tần xuất như một cặp xúc xắc thông thường (tổng bằng 2 với xác xuất 1/36, tổng bằng 3 với xác suất 2/36, v.v..).
- Craps.
Here are the rules for a pass bet in the game of craps: Roll
two 6-sided dice, and let x be their sum.
- If x is 7 or 11, you win.
- If x is 2, 3, or 12, you lose.
- If their sum is x, you win.
- If their sum is 7, you lose.
- Dynamic histogram. Suppose that the standard input stream is a sequence of double values. Write a program that takes an integer N and two double values l and r from the command line and uses StdStats to plot a histogram of the count of the numbers in the standard input stream that fall in each of the N intervals defined by dividing (l , r) into N equal-sized intervals. Use your program to add code to your solution to exercise 2.2.3 to plot a histogram of the distribution of the numbers produced by each method, taking N from the command line.
- Tukey plot. A Tukey plot is a data visualization that generalizes a histogram, and is appropriate for use when each integer in a given range is associated with a set of y values. For each integer in the range, we compute the mean, standard deviation, 10th percentile, and 90th percentile of all the associated y values; draw a vertical line with x-coordinate i running from the 10th percentile y value to the 90th percentile y value; and then draw a thin rectangle centered on the line that runs from one standard deviation below the mean to one standard deviation above the mean. Suppose that the standard input stream is a sequence of pairs of numbers where the first number in each pair is an int and the second a double value. Write a StdStats and StdDraw client that takes an integer N from the command line and, assuming that all the int values on the input stream are between 0 and N-1, uses StdDraw to make a Tukey plot of the data.
- IFS. Experiment with various inputs to IFS.java to create patterns of your own design like the Sierpinksi triangle, Barnsley fern, or other examples in the table in the text. You mihgt begin b experimenting with minor modifications to the given inputs.
- IFS matrix implementation. Write a version of IFS.java that uses Matrix.multiply() (see Exercise 2.2.11) instead of the equations that compute the new values of x0 and y0.
- Stress test. Develop a client that does stress testing for StdStats.java. Work with a classmate, with one person writing code and the other testing it.
- Gamblers ruin. Develop a StdRandom.java client to study the gamblers ruin problem (see Program 1.3.8 and Exercises 1.3.21–24). Note: efining a static method for the experiment is more difficult than for Bernoulli.java because you cannot return two values.
- Library for properties of integers. Develop a library based on the functions that we have considered in this book for computing properties of integers. Include functions for determining whether a given integer is prime; whether two integers are relatively prime; computing all the factors of a given integer; the greatest common divisor and least common multiple of two integers; Eulers totient function (Exercise 2.1.26); and any other functions that you think might be useful. Include overloaded implementations for long values. Create an API, a client that performs stress testing, and clients that solve several of the exercises earlier in this book.
- Voting machines. Develop a StdRandom.java client (with appropriate static methods of its own) to study the following problem: Suppose that in a population of 100 million voters, 51% vote for candidate A and 49% vote for candidate B. However, the voting machines are prone to make mistakes, and 5% of the time they produce the wrong answer. Assuming the errors are made independently and at random, is a 5% error rate enough to invalidate the results of a close election? What error rate can be tolerated?
- Poker analysis. Write a StdRandom.java and StdStats.java client (with appropriate static methods of its own) to estimate the probabilities of getting one pair, two pair, three of a kind, a full house, and a flush in a five-card poker hand via simulation. Divide your program into appropriate static methods and defend your design decisions. Extra credit: Add straight and straight flush to the list of possibilities.
- Music library. Develop a library based on the functions in PlayThatTuneDeluxe.java that you can use to write client programs to create and manipulate songs.
- Animated plots. Viết một chương trình lấy một tham số dòng lệnh M và tạo một biểu đồ cột của M giá trị kiểu double gần nhất đọc từ input chuẩn. Sử dụng kĩ thuật hoạt hình ta đã dùng cho BouncingBall.java(mục 1.5): xóa, vẽ lại, hiển thị, và đợi một chút. Mỗi lần chương trình đọc một số mới, nó cần vẽ lại toàn bộ biểu đồ. Do phần lớn biểu đồ không thay đổi khi nó được vẽ dịch một chút sang trái, chương trình của bạn sẽ tạo hiệu ứng của một cửa sổ có kích thước cố định trượt dần qua các giá trị dữ liệu vào. Dùng chương trình của bạn để vẽ một file dữ liệu lớn thay đổi theo thời gian, chẳng hạn giá cổ phiếu.
- Array plot library. Develop your own plot methods that improve upon those in StdStats.java. Be creative! Try to make a plotting library that you think that you will use for some application in the future.
Web Exercises
- Sample standard deviation. The sample standard deviation of a sequence of N observations is defined similar to the standard deviation except that we divide by N-1 instead of N. Add a method sampleStddev() that computes this quantity.
- Barnsley fern.
Write a program Barnsley.java
that takes a command line argument N and plots a sequence of N points
according to the following rules. Set (x, y) = (0.5, 0). Then update
(x, y) to one of the following four quantities according to the probabilities
given.
PROBABILITY NEW X NEW Y 2% 0.5 0.27y 15% -0.139x + 0.263y + 0.57 0.246x + 0.224y - 0.036 13% 0.170x - 0.215y + 0.408 0.222x + 0.176y + 0.0893 70% 0.781x + 0.034y + 0.1075 -0.032x + 0.739y + 0.27
The pictures below show the results after 500, 1000, and 10,000 iterations.


- Black-Scholes. The Black-Scholes model predicts that the asset price at time t will be S' = S exp { (rt - 0.5*sigma^2*t + sigma ε sqrt(t) }, where epsilon is a standard Gaussian random variable. Can use Monte Carlo simulate to estimate. To estimate the value of the option at time T, compute max(S' - X, 0) and take mean over many trials of epsilon. The value of the option today is e^-rT * mean. European put = max(X - S', 0). Reuse function. Name your program BlackScholes.java. See Exercise 2.1.30 for an exact formula for this case.
- Simulation. Application: some kind of simulation which uses StdRandom and StdStats to flip coins and analyze mean/variance. [Ex: physics, financial based on Black-Scholes hedge simulation. Simulation needed to price options whose payoff depends on the price path, not just the price at the maturity time T. Ex: Asian average price call = max(0, S_bar - X) where S_bar is the average price of the asset from time 0 to T. Lookback option = max(0, S(T) - min_t S_t). Idea: discretize time into N periods.] another reference Break up simulation into various pieces encapsulated as functions.
- Flaming fractals. Implement a generalization of IFS to produce fractal flames like Water Lilies by Roger Johnston. Flaming fractals differ from classic IFS by using nonlinear update functions (sinusoidal, spherical, swirl, horseshoe), using a log-density display to color pixels according to how many times they result in the process, and incorporating color based on which rule was applied to get to that point.
- Random point on a sphere. Use StdRandom.gaussian() to generate a random point on the surface of a sphere or hypersphere using the following method: generate N random values from the gaussian distribution, x[0], ..., x[N-1]. Then (x[0]/scale, ..., x[N-1]/scale) is a random point on the N-dimensional sphere, where scale = sqrt(x[0]^2 + ... + x[N-1]^2).
- Coupon collector. Write a modular program CouponExperiment.java that runs experiments to estimate the value of the quantity of interest in the coupon collector problem. Compare the experimental results from your program with the mathematical analysis, which says that the expected number of coupons collected before all N values are found should be about N times the Nth Harmonic number (1 + 1/2 + 1/3 + ... + 1/N) and the standard deviation should be about N π / sqrt(6).